Integrative multi-platform meta-analysis of hepatocellular carcinoma gene expression profiles for identifying prognostic and diagnostic biomarkers


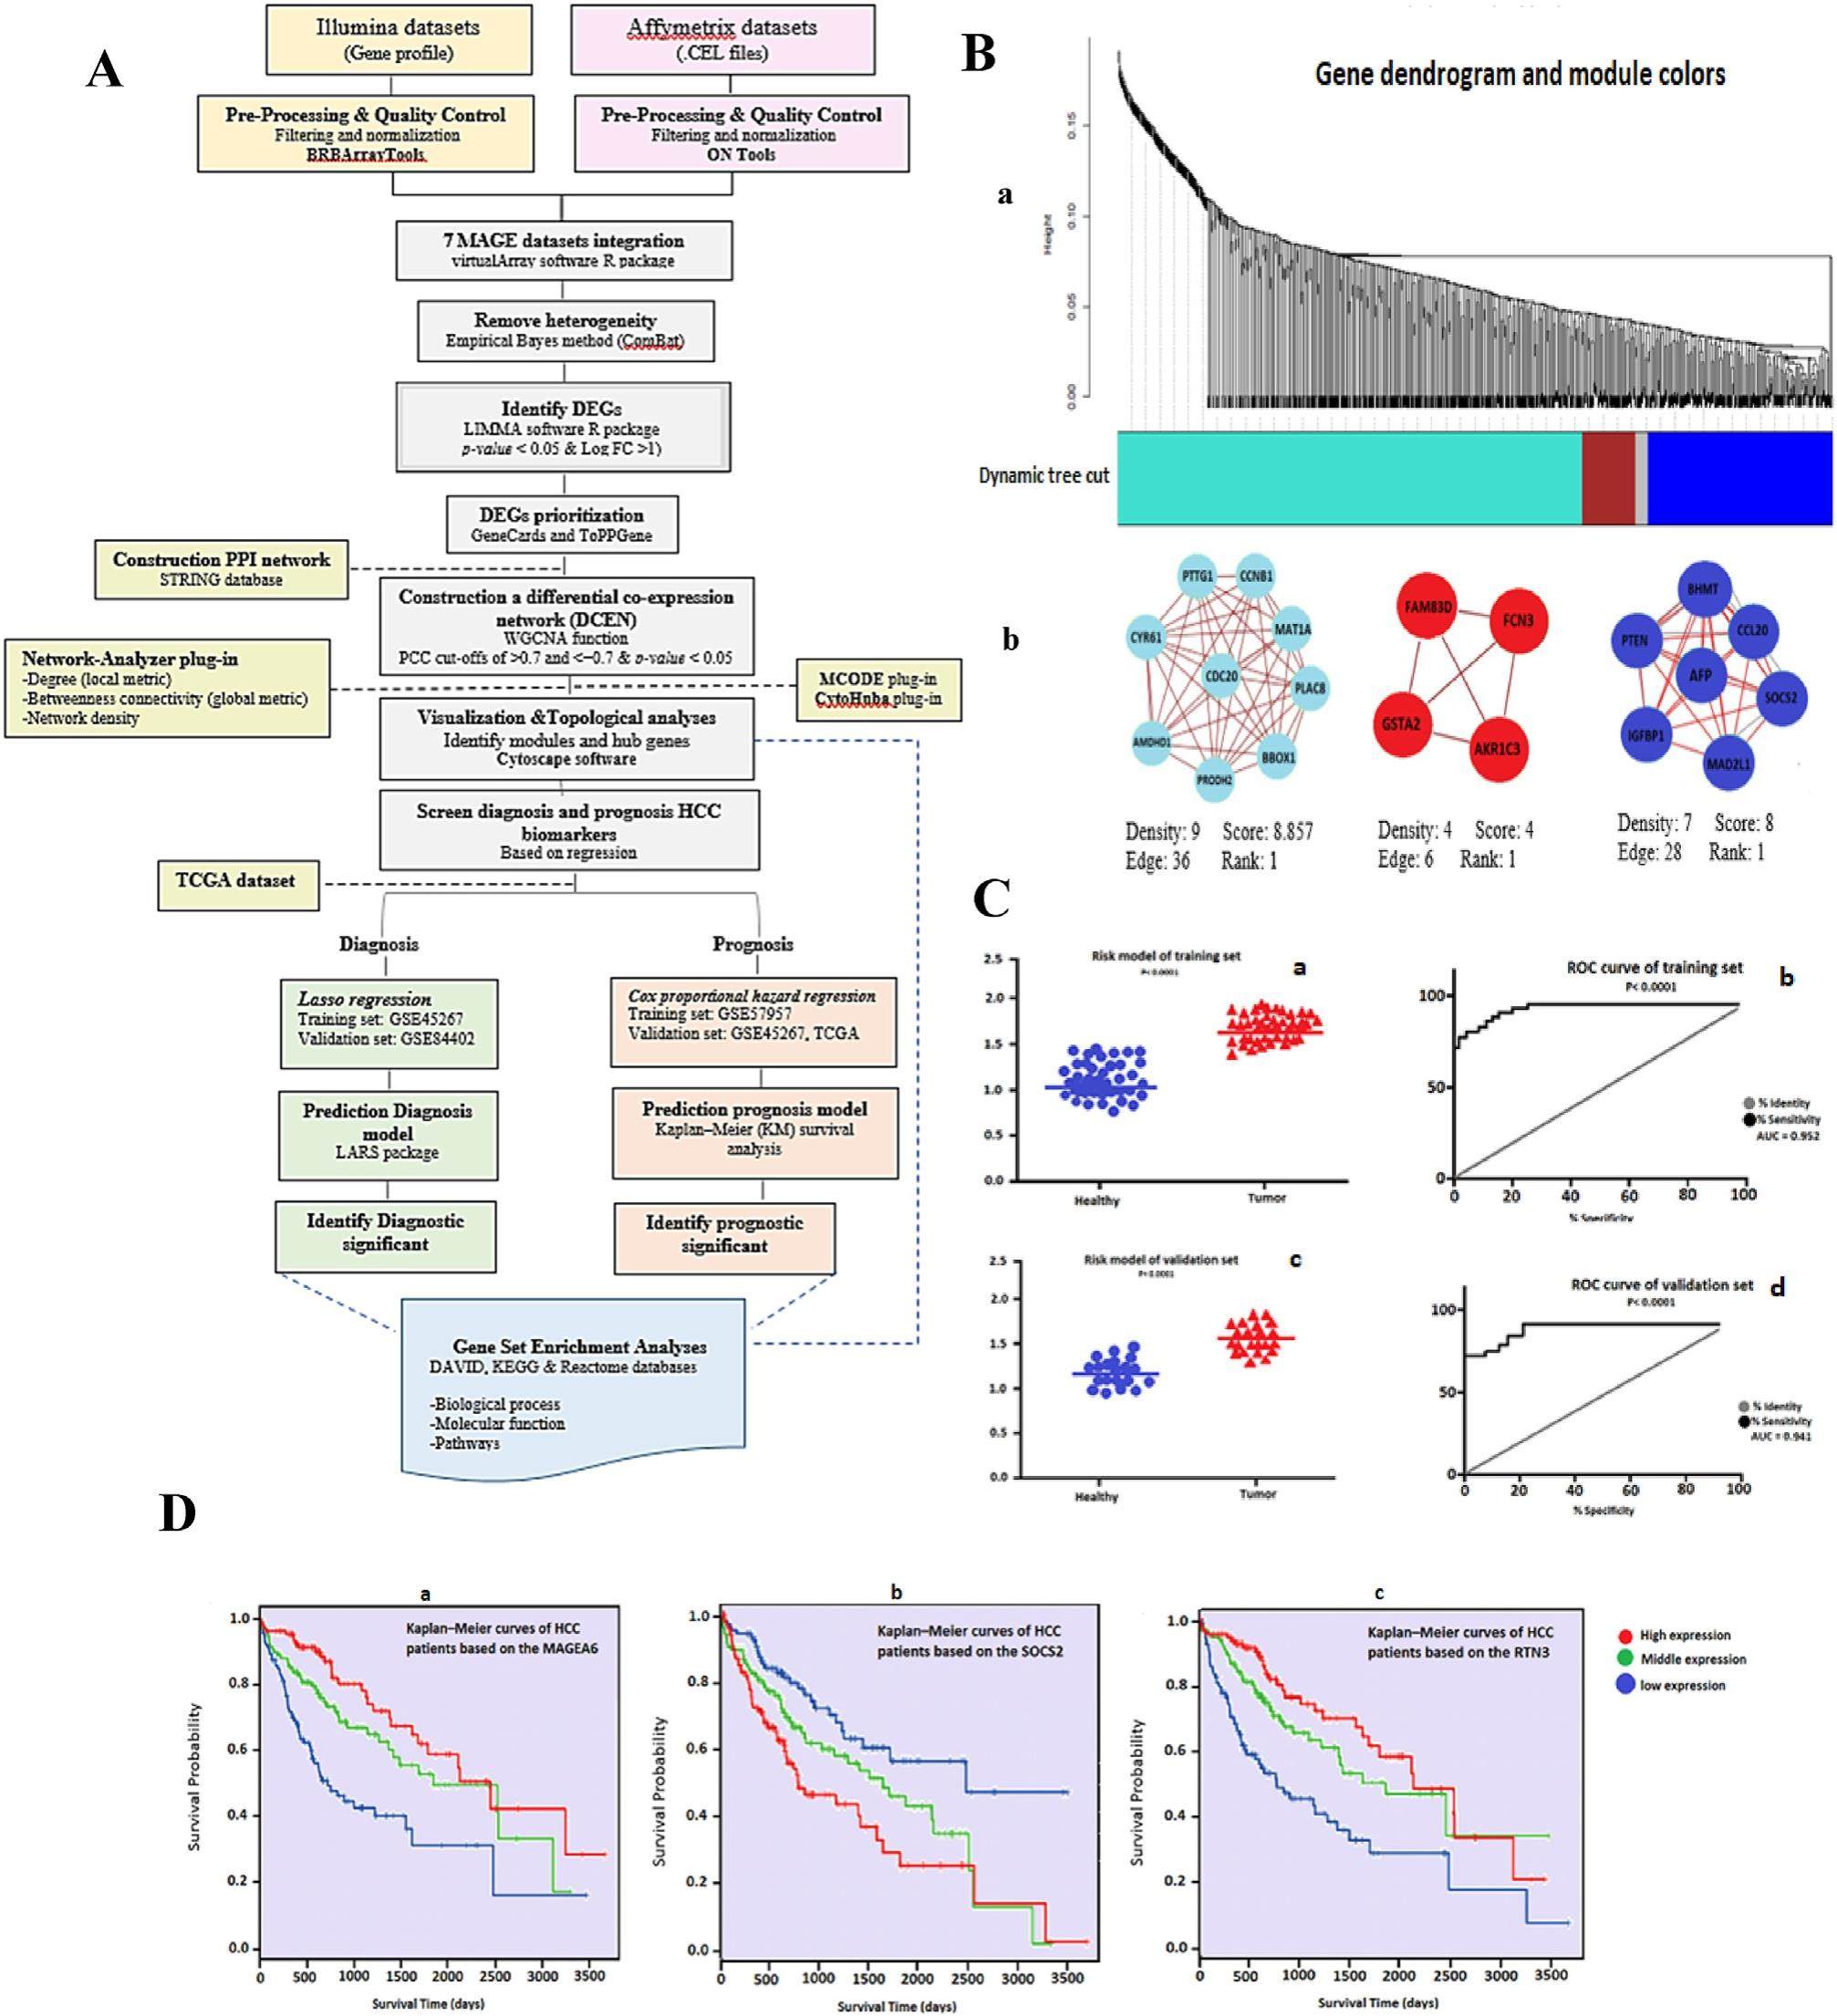
Hepatocellular carcinoma (HCC), as one of the most common types of primary liver cancer (PLV), accounts for approximately 75%-90% of all PLV casesidentified worldwide. Currently, the most effective treatment for HCC patients constitutes liver transplantation. However, due to high rates of recurrence a poor prognosis is predicted. Therefore, accurate HCC biomarkers are urgently needed to develop innovative therapeutics. Most of earlier investigations to identify biomarkers have been severely limited by sample size, as those studies used only data sets generated on the same chip platform. Considering the decisive role of sample size, we aimed to identify and validate diagnosis and prognosis biomarkers associated with HCC based on the expression data of seven transcriptome microarray gene expression (MAGE) datasets from two different platforms, namely Illumina and Affymetrix. To discover differentially expressed genes (DEGs), a metaanalysis based on an empirical Bayesian approach (ComBat) was first applied to the gene expression profiles of 939 tissue samples. Irigoyen et al technique was used to preprocess and integrate the data. Data import, data filtering, and normalization for each experiment were carried out separately (Text S1.1). Then, using the bioin-formatics technique of weighted correlation network analysis (WGCNA), the highly associated prioritized DEGs (Text S1.2, S1.3) were clustered. To identify sub-clusters and confirm candidate genes, co-expression networks and topological analysis were applied (Text S1.4).Finally, for these genes, the least absolute shrinkage and selection operator (LASSO) regression model was used and validated to provide a diagnostic model (Text S1.5).To construct a prognostic model, the Cox proportional hazard regression analysis was applied and validated (Text S1.6).All statistical tests were two-sided (Text S1.7) and the results with an adjusted p-value≤0.05 were considered statistically significant (Text S1.8).The flowchart diagram is presented in Figure 1A. The comparative boxplots and PCA plots in Fig. S1AeD, confirm the efficacy of the ComBat for batch effect removal. From the meta-analysis, 292 genes were identified as DEGs, satisfying the criteria of the absolute value of log2-fold change (logFC) > 1 and false discovery rate (FDR) < 0.05. Moreover, to assess bias and reproducibility across microarray experiments, we modified a comparison of individual analyses using data from two platforms and a meta-analysis. The result of integrative meta-analysis after prioritization showed 239 common DEGs (Text S2.1 and Table S5).We found possible relationships between the expression profiles of 239 mutual DEGs using Pearson's correlation coefficients (PCCs).The hierarchical cluster tree and topological overlapping matrix were used to screen out cluster modules. DEGs were divided into four parts, of which blue, red, and turquoise modules were considered the most significant parts. Through the application of the molecular complex detection (MCODE) plug-in, the sub-clusters of differential co-expression module (DCEM) were found and visualized.
